Want to have a general sense how prices are trending in the comic collectors market? Look no further!
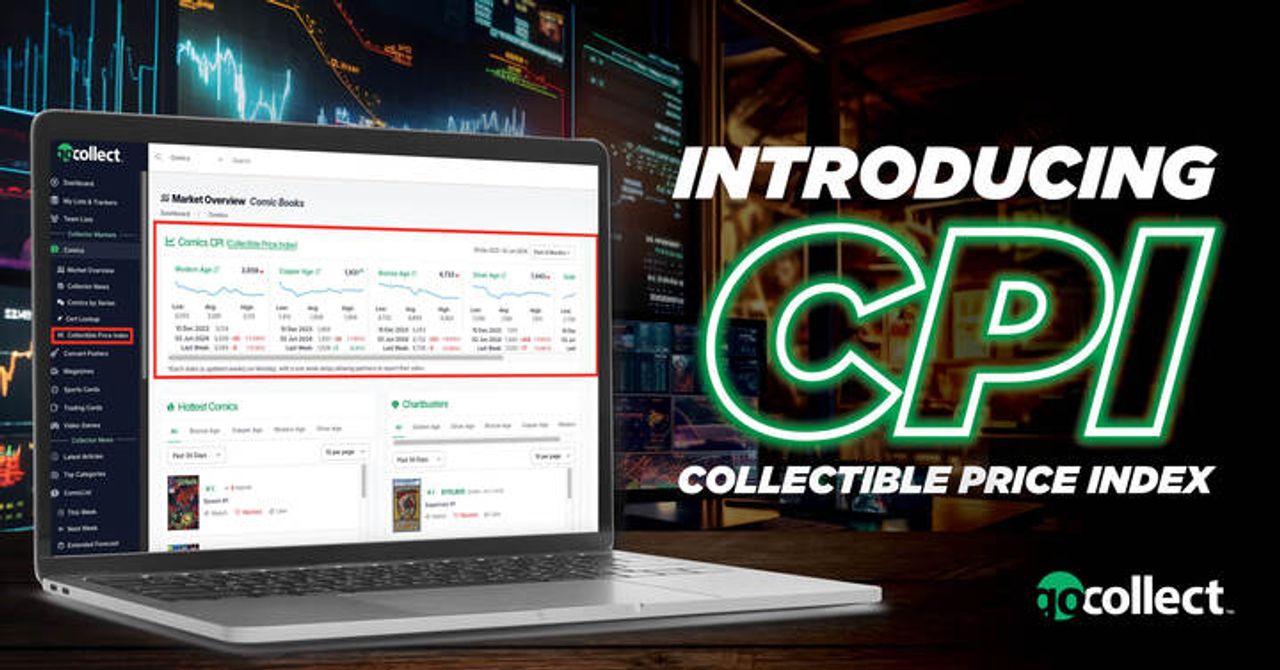
Here at GoCollect we've developed what we're calling a Collectible Price Index.
Check it out on the CPI Overview page (a link can be found in the Comics menu). If you're logged in, you'll also see it on the Comics Market Overview.
The Concept
The idea is fairly simple:
Identify comic books whose sales would be a decent indicator of the state of the market
Calculate a weekly value by aggregating the sale price averages for each of those comic books
Of course, the implementation gets a bit more complicated (but not terribly). As a core value here at GoCollect, in the interest of transparency we'd like to share those details on implementation.
The Algorithm
The algorithm is very similar to the DOW Jones Industrial Average.
The concept is rather straight-forward.
GoCollect Collectible Price Index | DOW Jones Industrial Average |
|---|---|
Identify a set of comic books that are hopefully a good indication of how the market is doing. | Identify a set of companies that are hopefully a good indication of how the market is doing. |
Take an average of the sale prices for each comic book. | Take the latest traded price of stock for each company. |
Sum up those average prices and divide by the index's "divisor". | Sum up those latest prices and divide by the index's "divisor". |
Example
Let's take a look at the Copper Age CPI. To follow along, check it out here.
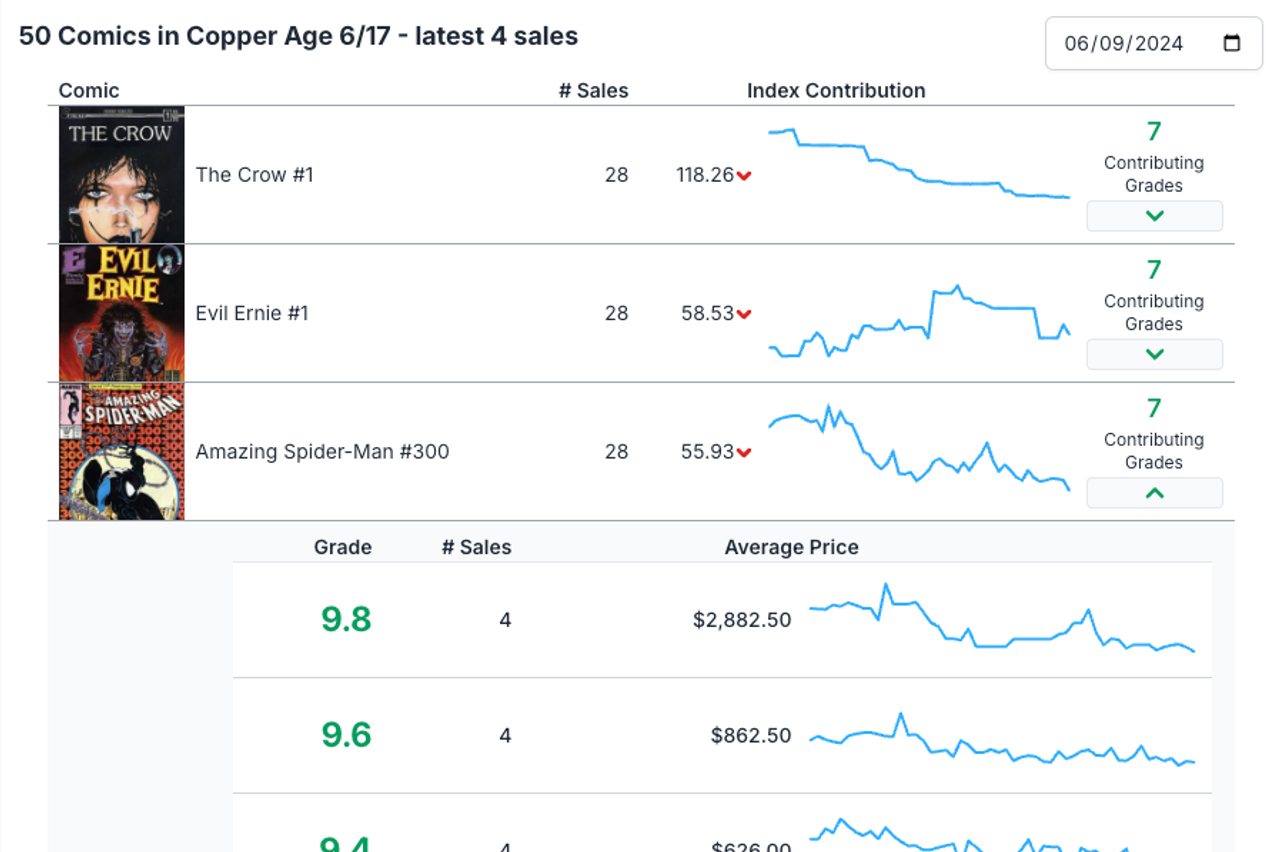
As of June 19th 2024, there are 50 comic books included in the index, each of them considering multiple grades.
Tip: On that page, you can change the date to see what comic books were in the index as of that date (it is possible for books to be added or removed over time).
Focusing in on Amazing Spider-Man #300, we can see it is contributing 55.93 to the index (value as of June 19th 2024 is 885). That 55.93 is all the averages for each grade added together, then divided by the "divisor".
Expanding the 7 contributing grades for Amazing Spider-Man #300, you'll be able to see exactly what those averages are for each grade, and also notice that we're averaging the latest 4 sales for each grade. For example, we can see the last 4 sales for 9.8 average to $2,882.50.
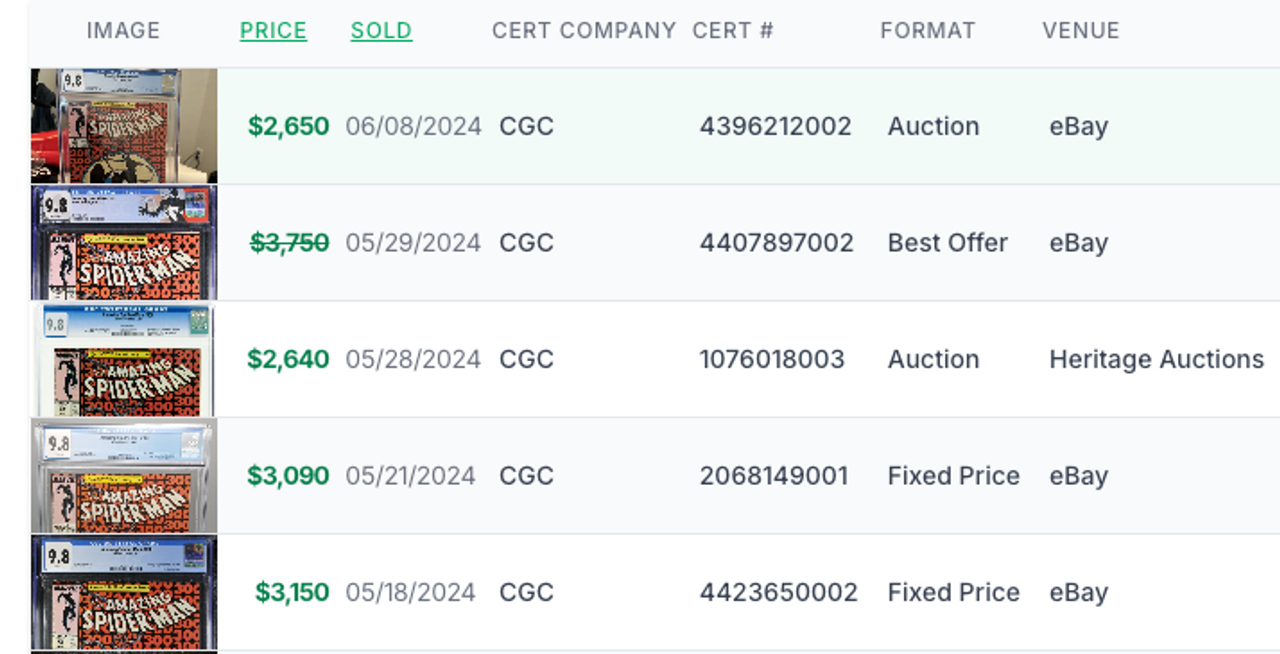
If we want to validate this, we can click on the comic book to go to its page and review the sales history there.
Hold the phone! When I average the last 4 sales on that page I get $3,032.50, but the CPI is showing $2,882.50. What gives???
See the FAQs below for more detail, but there are some rules that may disqualify a sale from being included in this valuation. In this example, the May 29th sale had a best offer accepted, and since the listing does not publicly display the actual sale price, we're not including it in this valuation.
Averaging the latest four sales that are valid for valuation purposes, it does indeed come out to $2,882.50.
If we then collect the averages for the rest of the grades for that book (you can if you want to validate things, but this is why we let the computers do the heavy lifting), you'll get a total value of $6,135.42. Dividing that by the divisor (currently 109.7), and you'll arrive at that 55.93 index contribution for Amazing Spider-Man #300.
Repeating that for all the books in the index, you'd be able to calculate the entire index value.
I understand the "divisor" maths. But... why?
Well, over time as the market ebbs and flows, some books that were once a great indication of how the market is doing may no longer be so, and others that were not at the time may now be.
However, if we take a comic book out of the index that has an average sale price of $1,000 and replace it with one that has an average price of $100, you can imagine that might cause a slight "jump" in the calculated value.
The "divisor" is a variable we can then tweak to make a smooth transition when adding or removing comic books from an index, just as the DOW Jones Industrial Average does when adding or removing companies from their index.
Note that the divisor may also be adjusted if a sale comes along for a grade that previously had no sales.
Divisor Example
For example, say the divisor is 100, and the sum of each comic book's sale price average for the index is $20,000. The index's value will then be calculated as 200 ($20,000 / 100). Now if we swap out that $1,000 book for the $100 book, then the sum total suddenly becomes $19,100 and the calculation with a "100" divisor becomes 191.
Obviously that (roughly) 5% drop in the index doesn't represent a 5% drop in the market's sale prices. Well, if we take the new $19,100 and divide it by the old "200" value, we get 95.5. With that as a new divisor, our calculation becomes $19,100 / 95.5 = 200.
Boom! We've successfully adjusted the index to better represent the market going forward, and we didn't introduce a false and scary change to the index's calculated value.
Ok, I understand ALL the math now, but still... why?
Well, some of you have been asking for this. And we feel the rest of the collecting community will only stand to benefit from the creation of a benchmark indicator towards the overall health of the collectible markets. Yes that's right, markets.
See, at the core of our CPI will be the comic book eras - from Golden Age to Modern. Each of those indexes is infused with carefully selected books that best represent the market movements of their period of time. Those spans, according to our indexes will be:
Golden Age: 1938-01-01 - 1956-08-31
Silver Age: 1956-09-01 - 1970-08-31
Bronze Age: 1970-09-01 - 1984-03-31
Copper Age: 1984-04-01 - 1993-12-31
Modern Age: 1994-01-01 - present
As I said above, some books will come and go from each list over time according to the market, but for the many that have served as touchstones of their era, they will likely remain affixed to their index just as IMB has become a staple on the NYSE.
We felt it was time our markets got similar Big-League representation.
We built this tool with a combination of valuation and imagination in mind. And we are just getting started.
FAQs
Of course this is new, so these haven't been frequently asked yet, but we suspect they might be.
Uhm... how did you manage to forget to include some iconic books in these indexes?
Believe me when I say it felt so very wrong to not include Action Comics #1, Detective Comics #27, Amazing Fantasy #15, and many others in their respective indexes. However, please understand that they were excluded for the purpose of precision. And in order to keep these numbers on the mark, we had to leave our emotions at the door.
These comics sell for high and volatile prices, and we feel they do not accurately reflect or represent the era in it's entirety. Of course they are iconic books that are massively representative of the era when it comes to the story and artwork, but with the collectible price index focusing on the prices, it logically doesn't make sense to include them, even though it feels so wrong not to.
For example, if a single sale of one of these high-value books caused the index to jump or drop 5%, that wouldn't necessarily reflect how the market as a whole is doing.
All that said, it is still incredibly interesting to follow these high-value books, so we've put together a "Big Spenders Club" CPI that contains books which we have recorded sales of $250,000 or more. Check it out here.
While it felt wrong to exclude them from their era's indexes, we're glad we still found a home for them.
Which sales are included?
We generally like to share all the sales on our site, but when it comes to valuation, we have some strict criteria we apply. The following must be true for a sale to be included in valuation:
The sold comic book must be graded by CGC with the Universal label
If the sale has a price strike-through on our site, it will not be included
The sale should be independently verifiable. This means we want you to be able to click through to the original site the transaction occurred on so you can also confirm the details of the sale (what was sold, for how much, when the sale happened, the condition of the item, etc.)
Can you break down what I'm looking at?
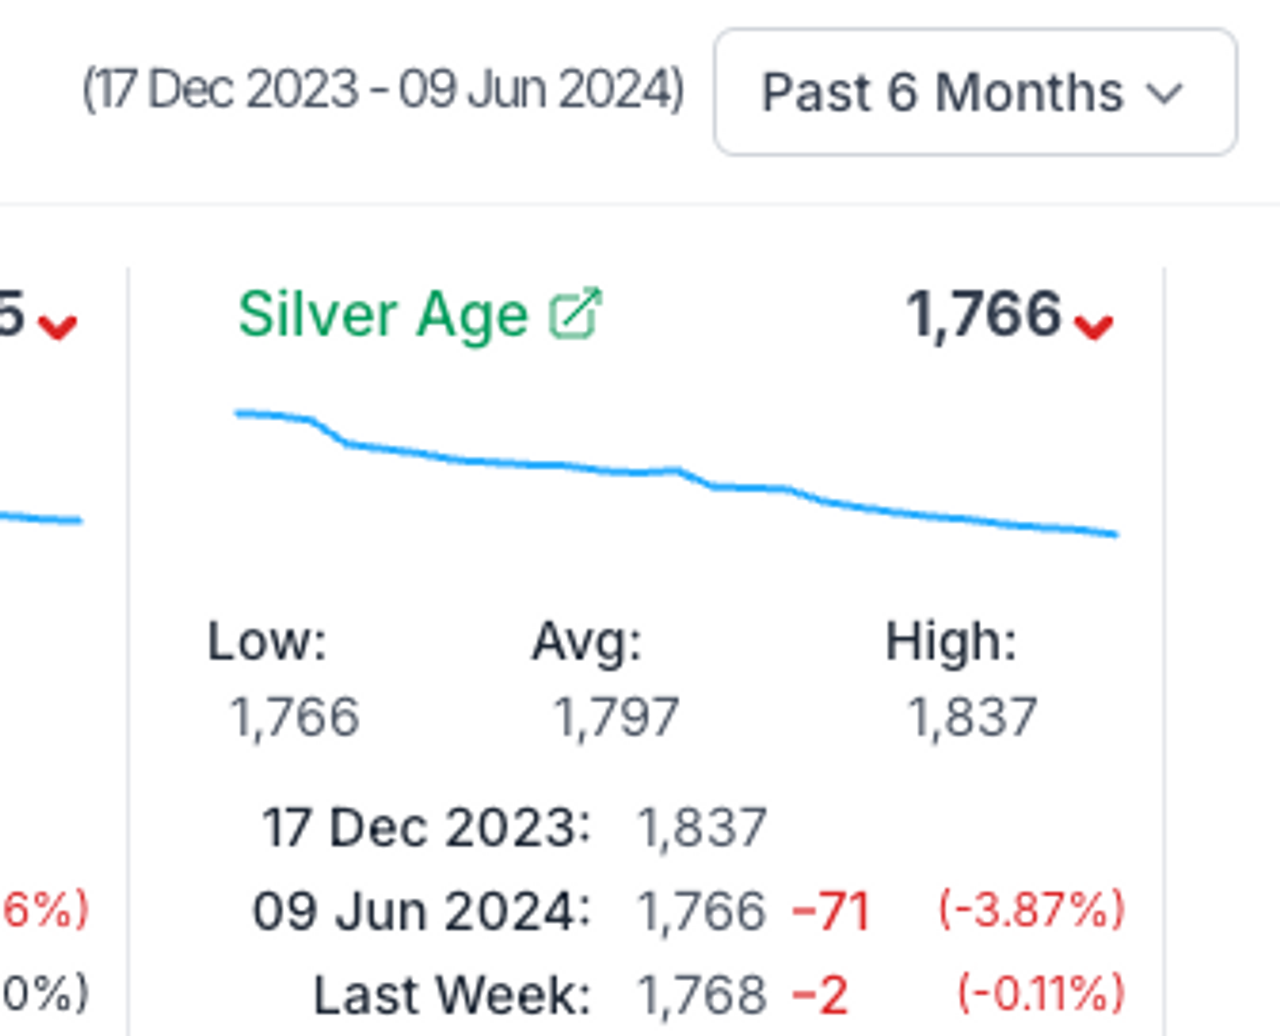
Sure! Let's focus on the Silver Age CPI, as shown here:
The "Past 6 Months" dropdown is the selected time range we're looking at. Next to it, we can specifically see that is referring to the weekly calculations between December 17th, 2023 and Jun 9th, 2024.
"1,766" in the top right indicates the current index value. The "down" symbol indicates the price is down from the prior week's calculation.
"Low", "Avg", and "High" show the lowest, average, and highest value during the time range selected. In this example, the lowest value in the last 6 months is 1,766, the average is 1,797, and the highest is 1,837. Interacting with the chart can help you identify the specific value for a date.
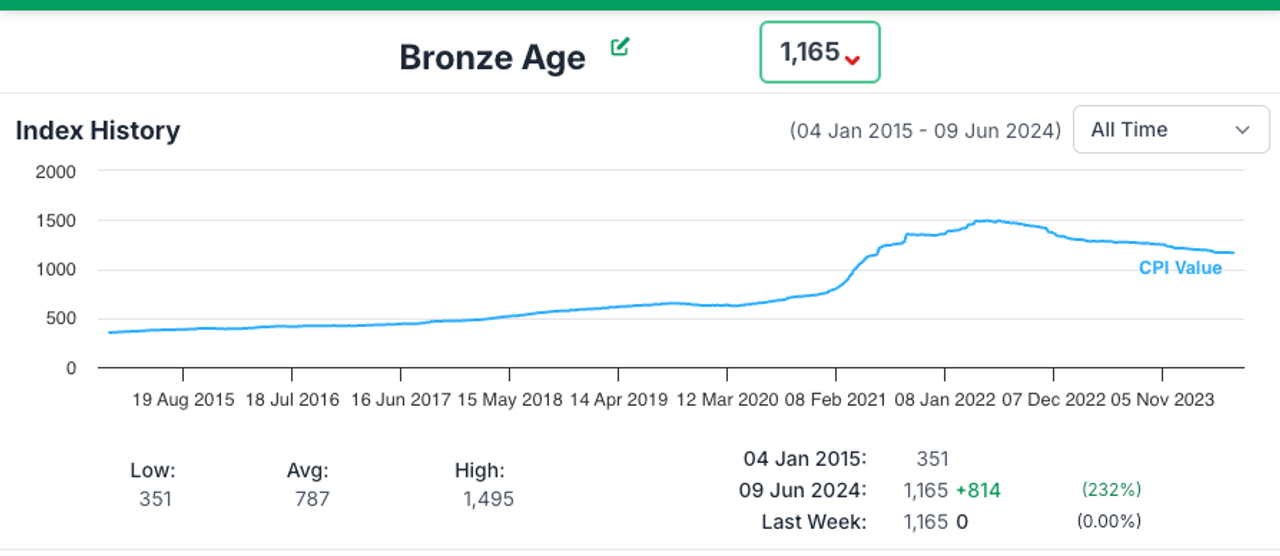
"17 Dec 2023" and "09 Jun 2024" are the "starting" and "ending" values for the time period selected. Next to the ending value, you see the total change during that time. In this case, the index dropped by 71, or 3.87%
"Last Week" indicates what the value was the prior week. In this case, it was 1,768 on June 2nd, 2024. Next to that is the difference from last week to this week, which shows here that the index dropped by 2, or 0.11%
When and how often are things calculated?
The index is updated weekly on Monday. The calculation includes sales through the prior Sunday, with a one week delay.
For example, if it is June 24th (Monday), the calculation will reflect the index value as of Sunday, June 16th.
Why the delay?
Sales from various venues are aggregated into this index. It may take time for these venues to report their sales and for us to process and activated them on our platform.
How can I see what the divisor is or which grades are considered?
If you look at the bottom of the page, it shows the parameters used in calculating the index.
For example, you'll see the Copper Age index is averaging the latest 4 CGC Universal sales for grades between 8.0 and 9.8. It also shows the current divisor as well as a history for when it has changed.
Why focus in on specific grades? How were these grades decided?
For some eras, certain grades don't make a lot of sense to consider. For the Modern Age, the vast majority of comics have higher grades. For the Golden Age, the highest grades tend to sell at very volatile prices and with such high values, they'd skew the index significantly.
To come up with grade ranges, we used the more common grades we found from analyzing the CGC Universal census for the comics included in each CPI.
How do the index values relate between each index?
They don't!
If one index has a value of "100" and another index has a value of "10,000" it does not mean anything for trying to compare the two. It would be like trying to compare the DOW vs. the S&P 500 vs. the Nasdaq, based on each index's current value.
Since the index value is an aggregate of average prices for the comics included in the index, the calculated value will depend on a few factors, such as the number of comics included in the index, their average prices, and the index's divisor. Each of those variables is specific to an individual index, making it meaningless to compare multiple indexes.
What if an index gets a bit stale because of changes in what is actually selling?
Fear not! We intend to review each index quarterly to keep it relevant. Specifically, we'll check if any of the comic books in the index no longer make sense to be included. We'll also be on the lookout for newly emerging comic books that are good candidates for the index.
Conclusion
We're pretty excited about this new Collectible Price Index feature, and hopefully this article has sufficiently introduced it.
...and not that you wanted to know how the DOW calculates it's stuff, but now you do (if you didn't already).
Would the ability to create your own index and share it with others be a feature you'd be interested in? Do you have any other feedback or suggestions? Please do share your thoughts!
Acknowledgments
GoCollect would like to acknowledge the support of participants in the gleaning and creation of the Collectible Price Index:
Donald Yu
Douglas Ohlandt
'Baltimore' Lauren Sisselman
Chris Severs
Joseph Overaitis
With special thanks and acknowledgement to Mickey Finnegan (aka Swagglehaus) for providing the comic community with his own relentless service, and who was kind enough to lay his eyes on our development in an earlier stage, and provided us with the motivation that we were on to something strong.
From the GoCollect Team - thank you to everyone who was involved.
